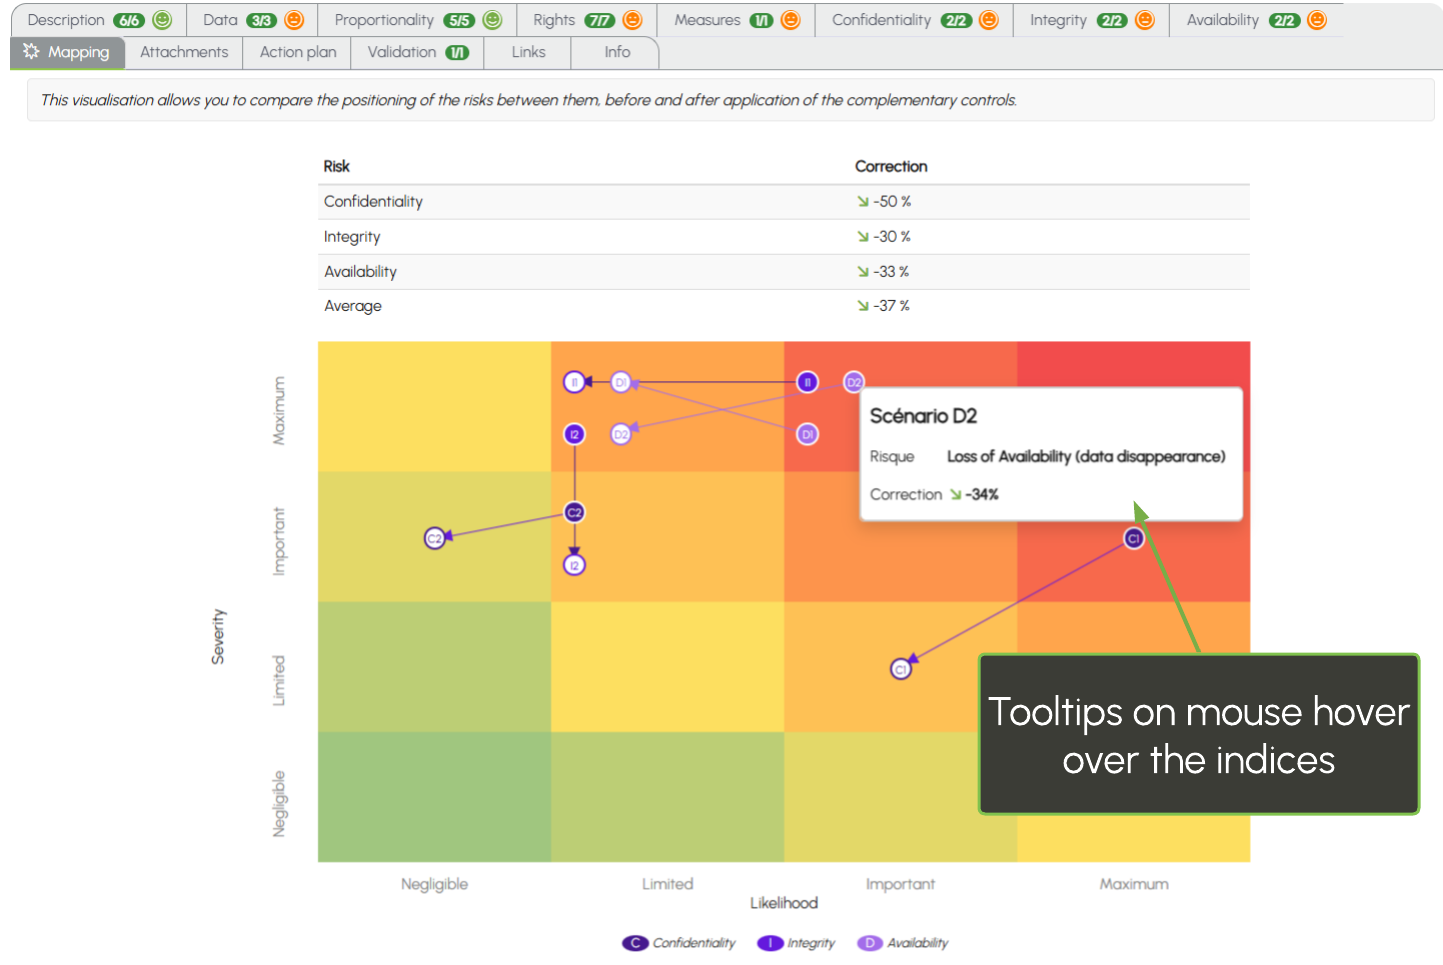
7. Risk Mapping
Compare the positioning of risk scenarios relative to each other, before and after the application of additional measures.
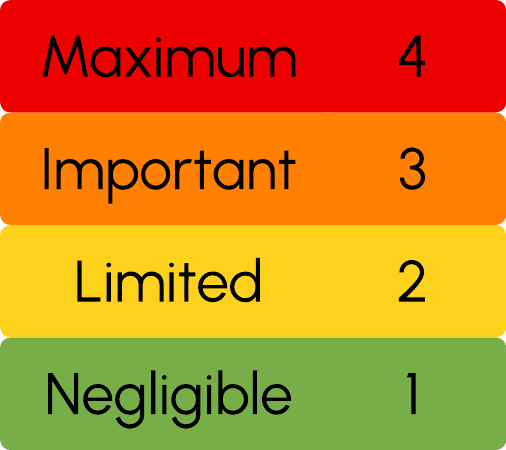
A score is assigned to the severity and likelihood levels:
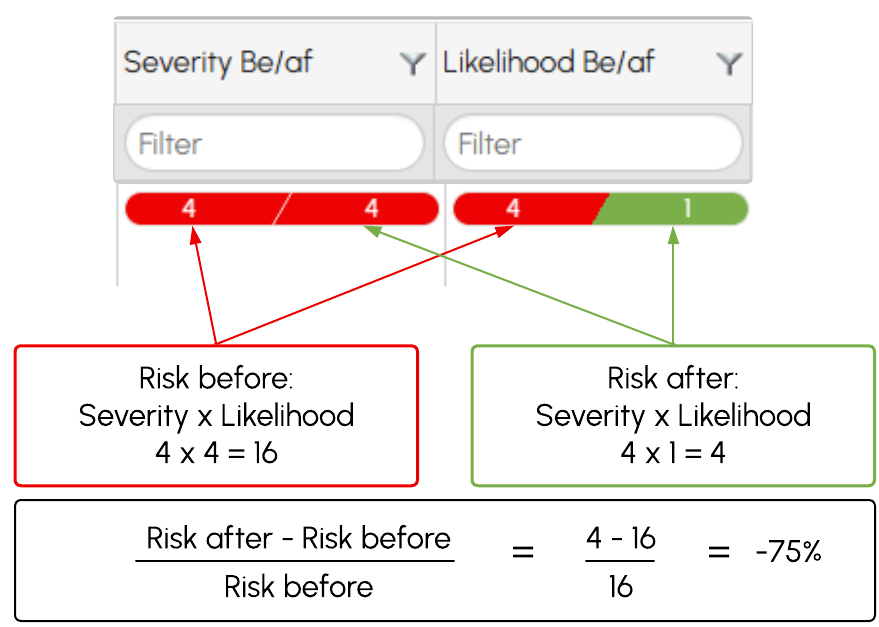
Risk correction calculation for one scenario:
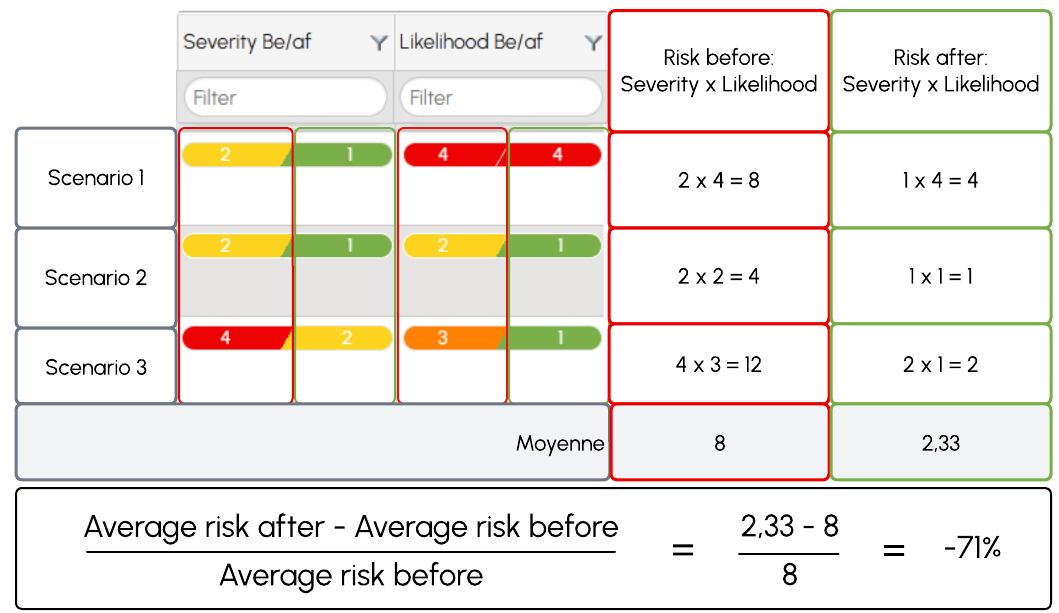
Calcul de la correction du risque pour plusieurs scénarios :